Europe
Loading...
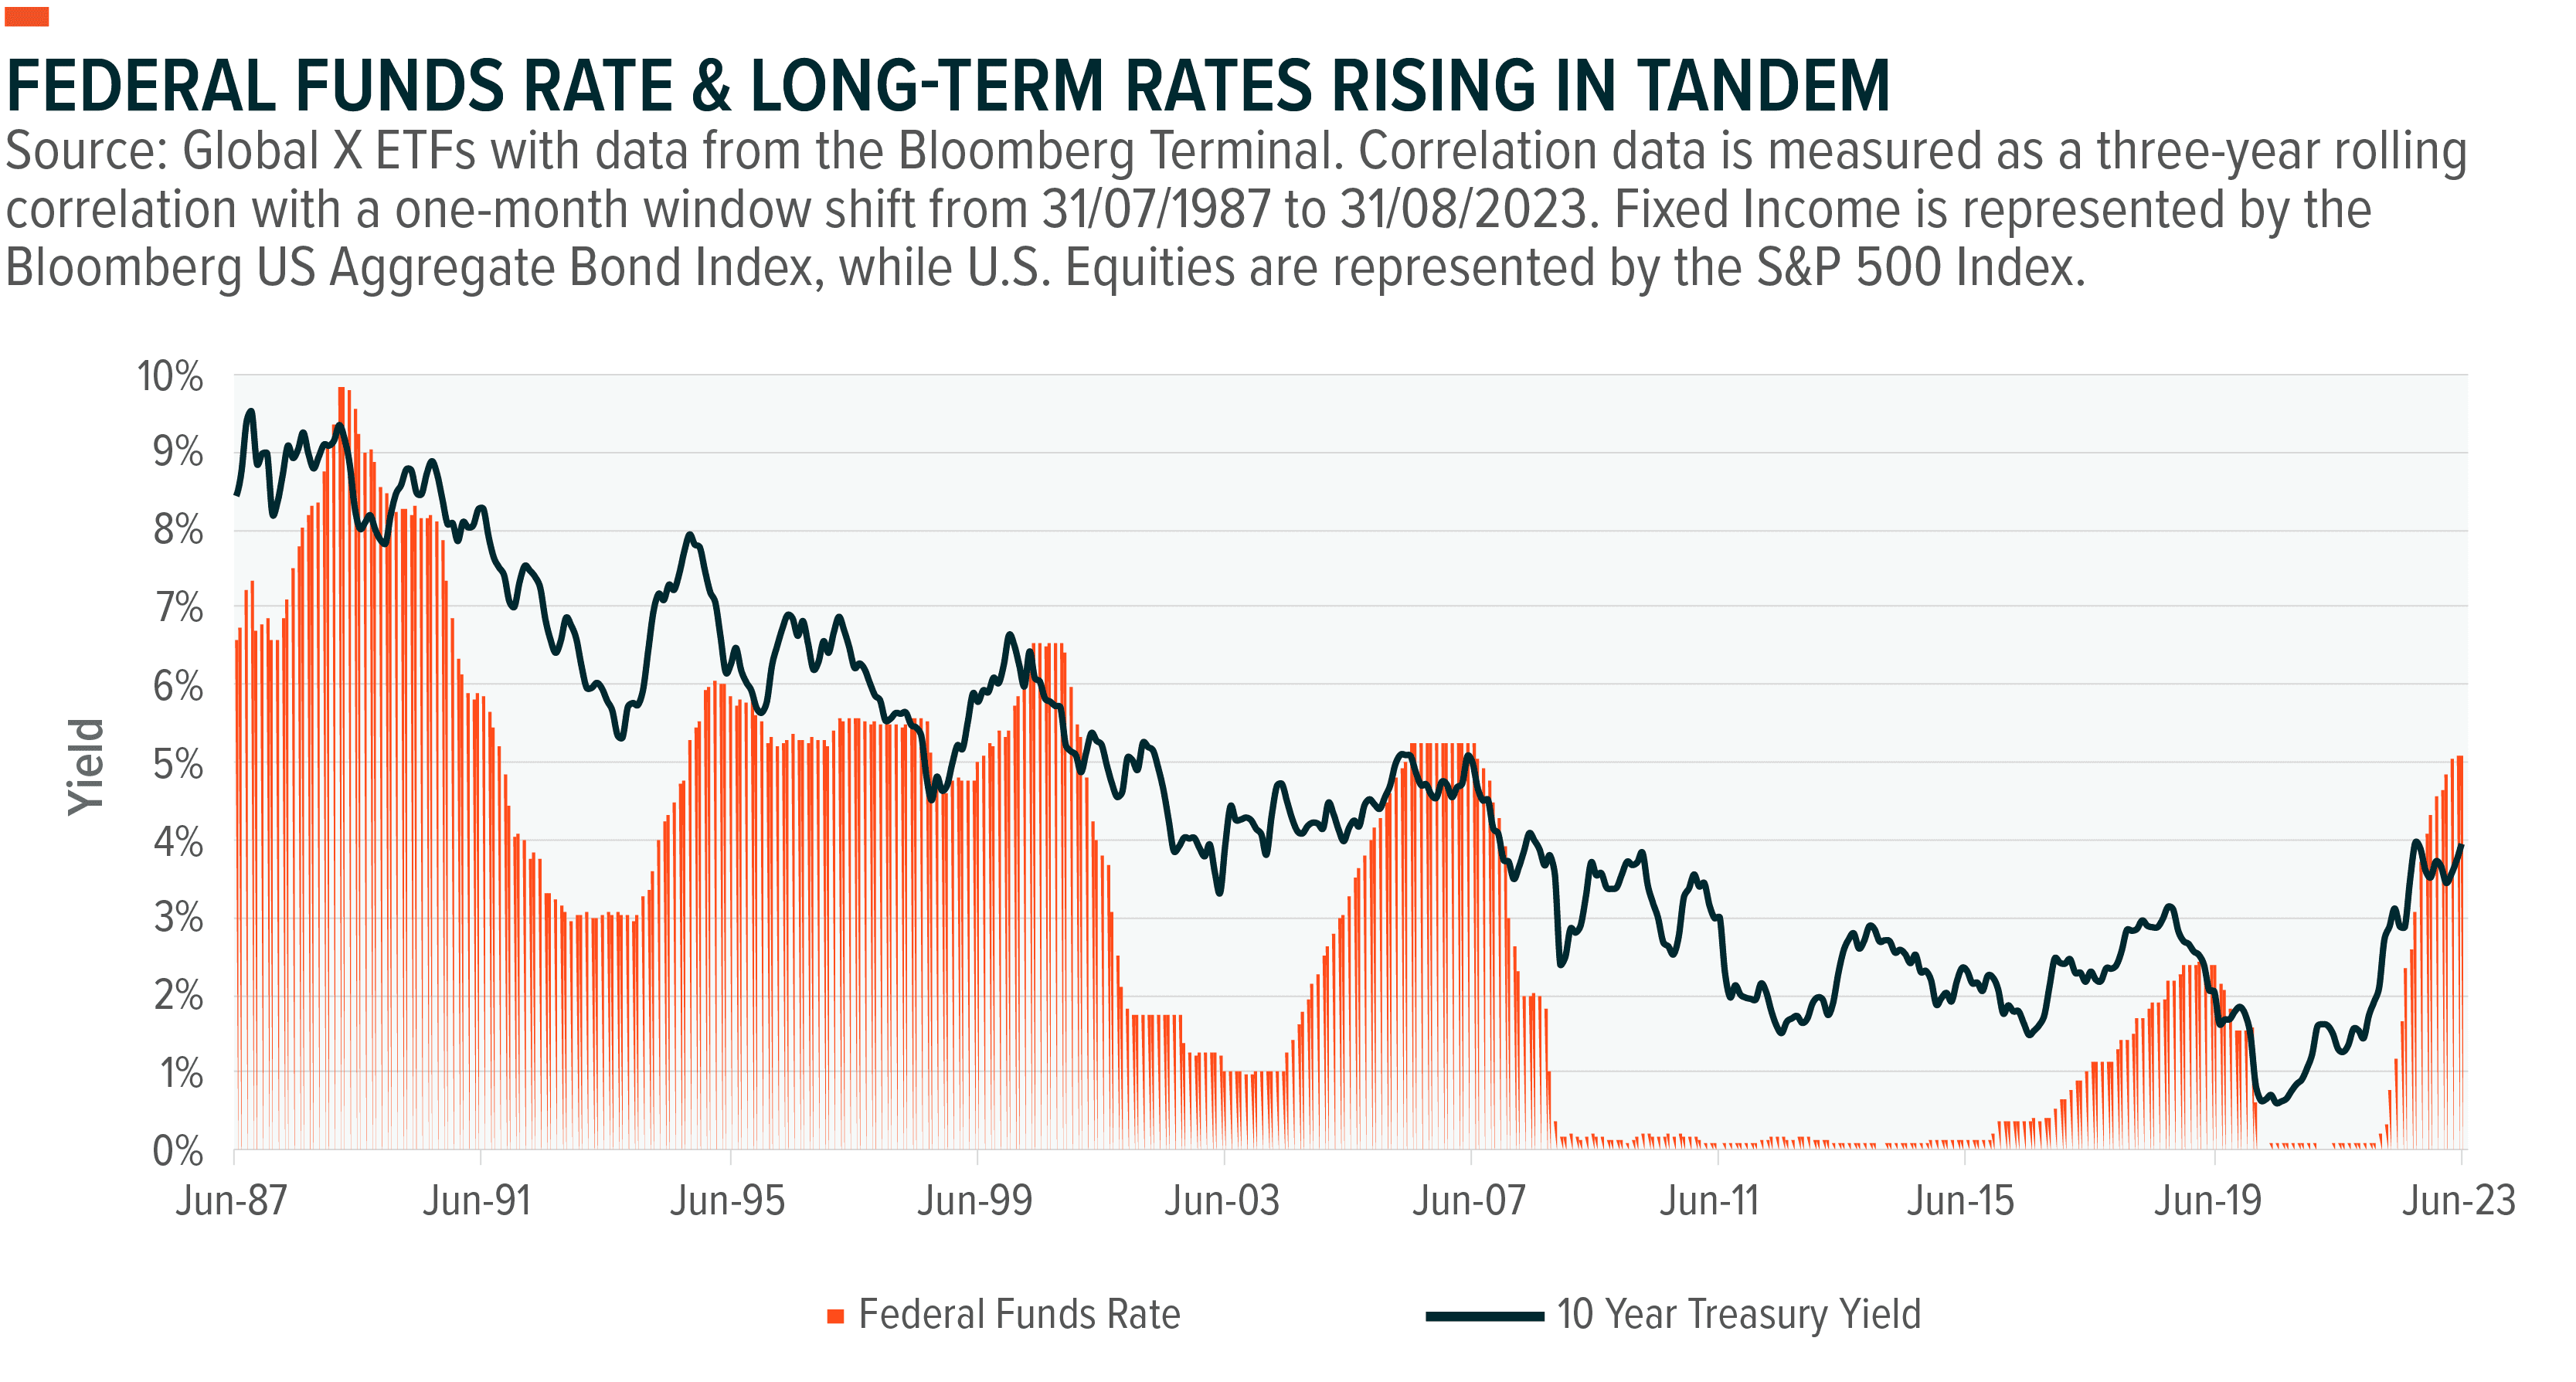
From the early 1980s until the beginning of 2022, the 60/40 portfolio, consisting of 60% stocks and 40% bonds, enjoyed a prosperous run.1 The Federal Reserve’s efforts to control inflation through advancing interest rate hikes in the early 1980s laid the groundwork for an eventual 40-year fixed income bull market. The COVID-19 pandemic marked a turning point, as the bull market encountered obstacles with the federal funds rate reaching zero-bound levels, in an effort to stimulate the economy. As a result, equities rallied, supported by cheap credit and a prevailing “there is no alternative” (TINA) mindset. The 10-year Treasury yield’s eventual decline below 50 basis points on the long end of the yield curve eroded the advantages of further policy rate cuts and Treasury yields across the maturity curve fell well below the inflation rate.2
The emergence of persistent inflation and rising Treasury yields introduced a wave of uncertainty about the effectiveness of the traditional 60/40 portfolio and the perceived diversification benefits as the correlations between equity and fixed income rose. In response, there has been a move towards alternative assets and securities, including options-based defined outcome strategies. These strategies offer the potential to mitigate downside risks and deliver defined returns within specific boundaries. In this piece, we explore the potential benefits of defined outcome strategies, examine the reasons for their increasing usage, and discuss the advantages that they could offer.
In 2022, downturns in the equity and fixed income markets raised notable concerns regarding the role historically played by the traditional 60/40 portfolio. For the first time since reliable data was recorded in 1928, both the S&P 500 and U.S. long-duration Treasuries registered double-digit negative annual returns. Adding to these complexities, the Federal Open Market Committee (FOMC) further intensified the situation by raising the federal funds rate to its highest level since 2001 during their July 2023 meeting and keeping rates the same at the September meeting.4
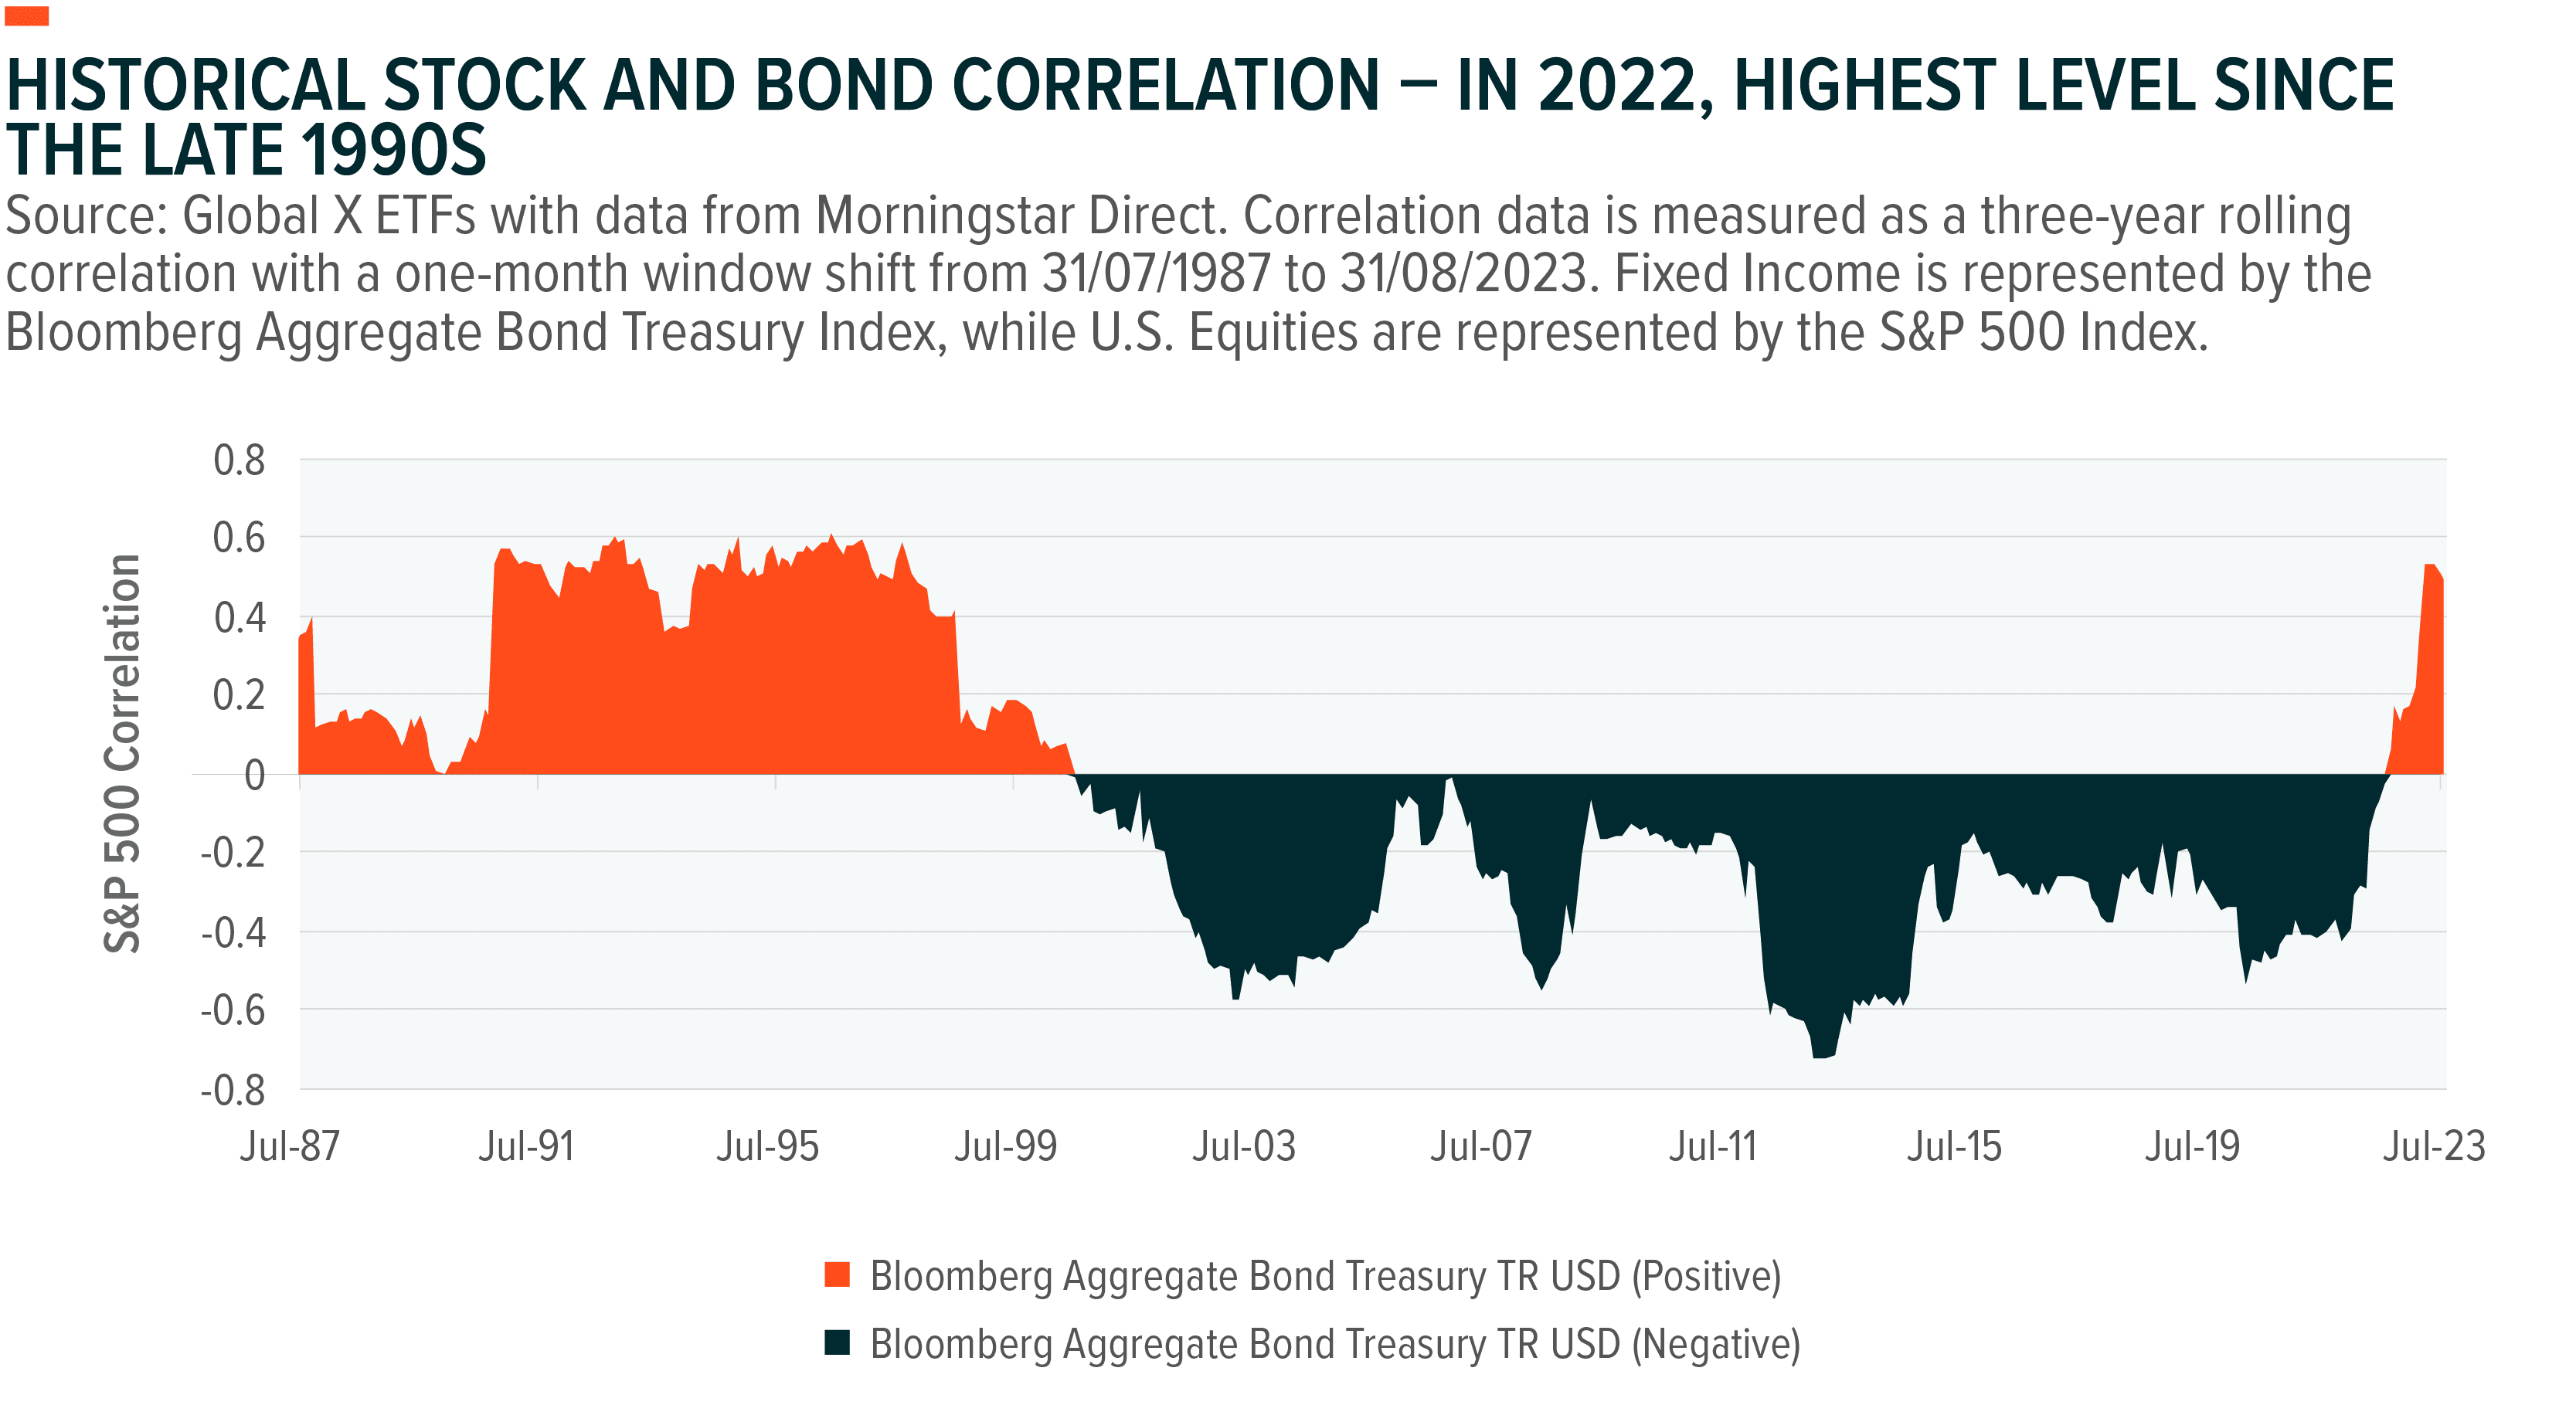
The Fed’s aggressive hiking coincided with a discernible upswing in the correlation between stocks and bonds. This rise in correlation can be attributed to several macro conditions, but most importantly, inflation hit its highest level since the Volcker Era in the 1980s, leading to similarly hawkish policy decisions.
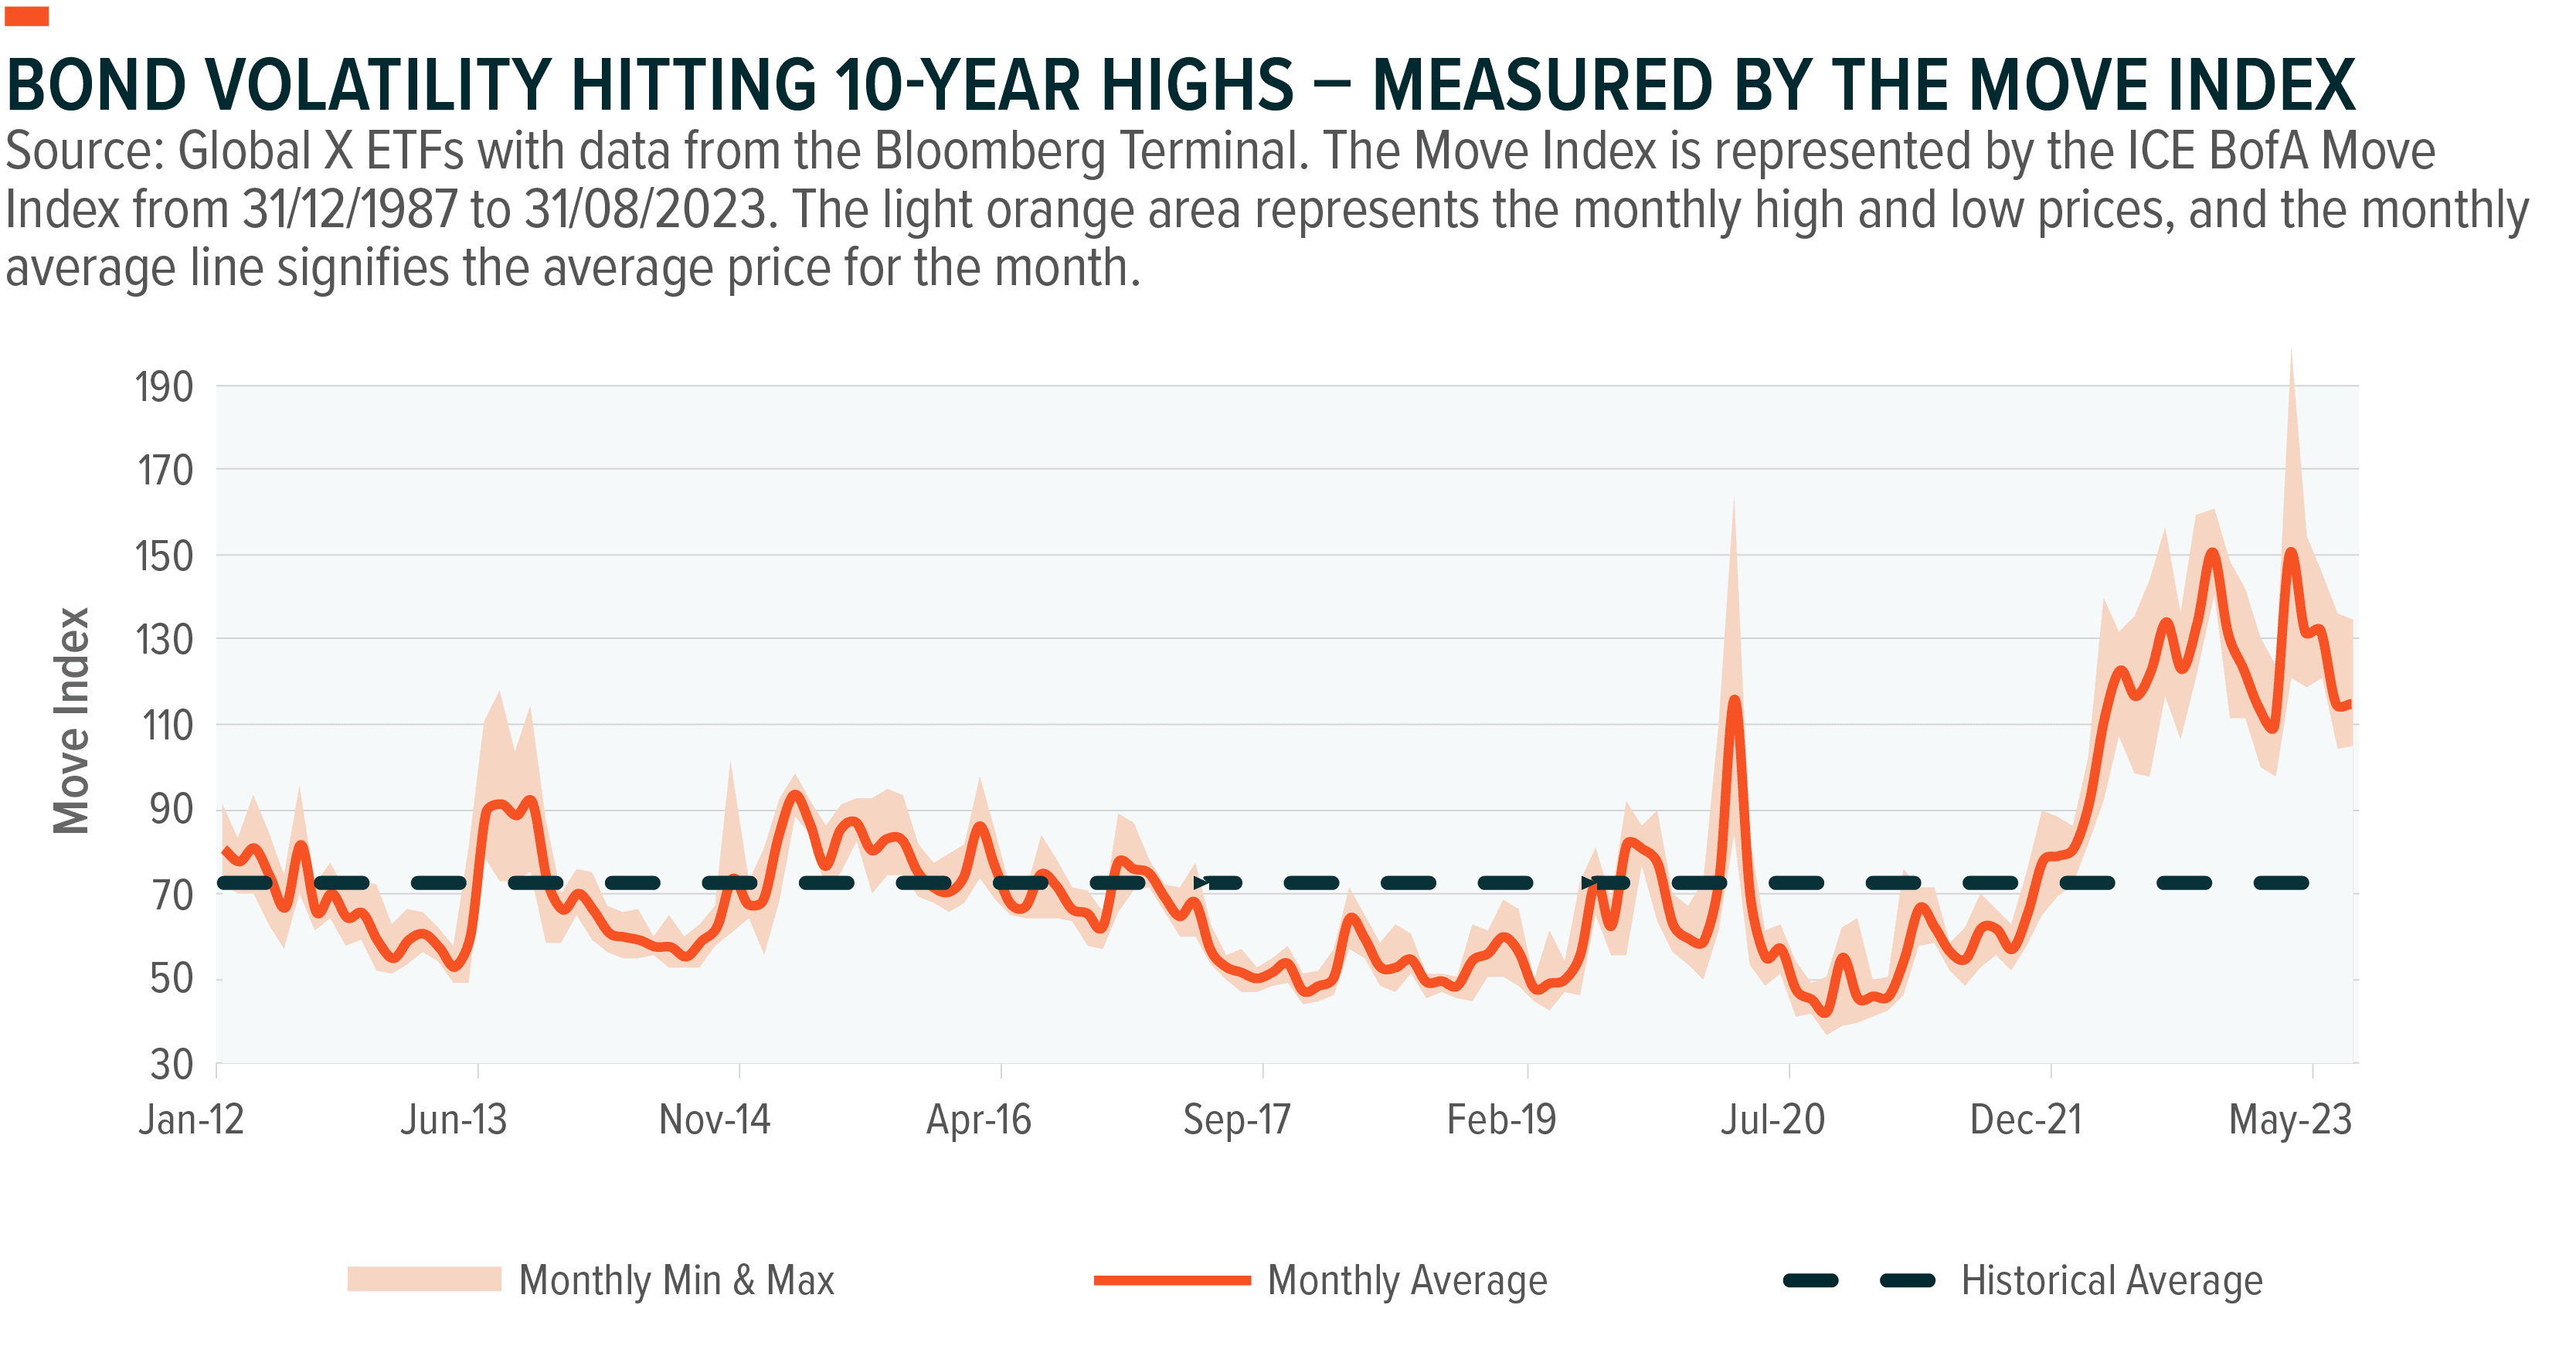
Bond market volatility reached 10-year highs in 2022, as indicated by the MOVE Index. Historically, the Federal Reserve uses countercyclical monetary policies during economic downturns, cutting the federal funds rate to reduce bond yields and increase bond prices, thus reinforcing the diversification benefits of fixed income. This time, persistent inflation and a resilient job market altered the Fed’s approach. The Fed prioritised bringing inflation back to neutral, hiking rates through consecutive negative GDP prints in Q1 and Q2 2022 and quarters with negative earnings. Sentiment soured on both the fixed income and equity front, prompting investors to explore alternatives with less pronounced volatility characteristics.5
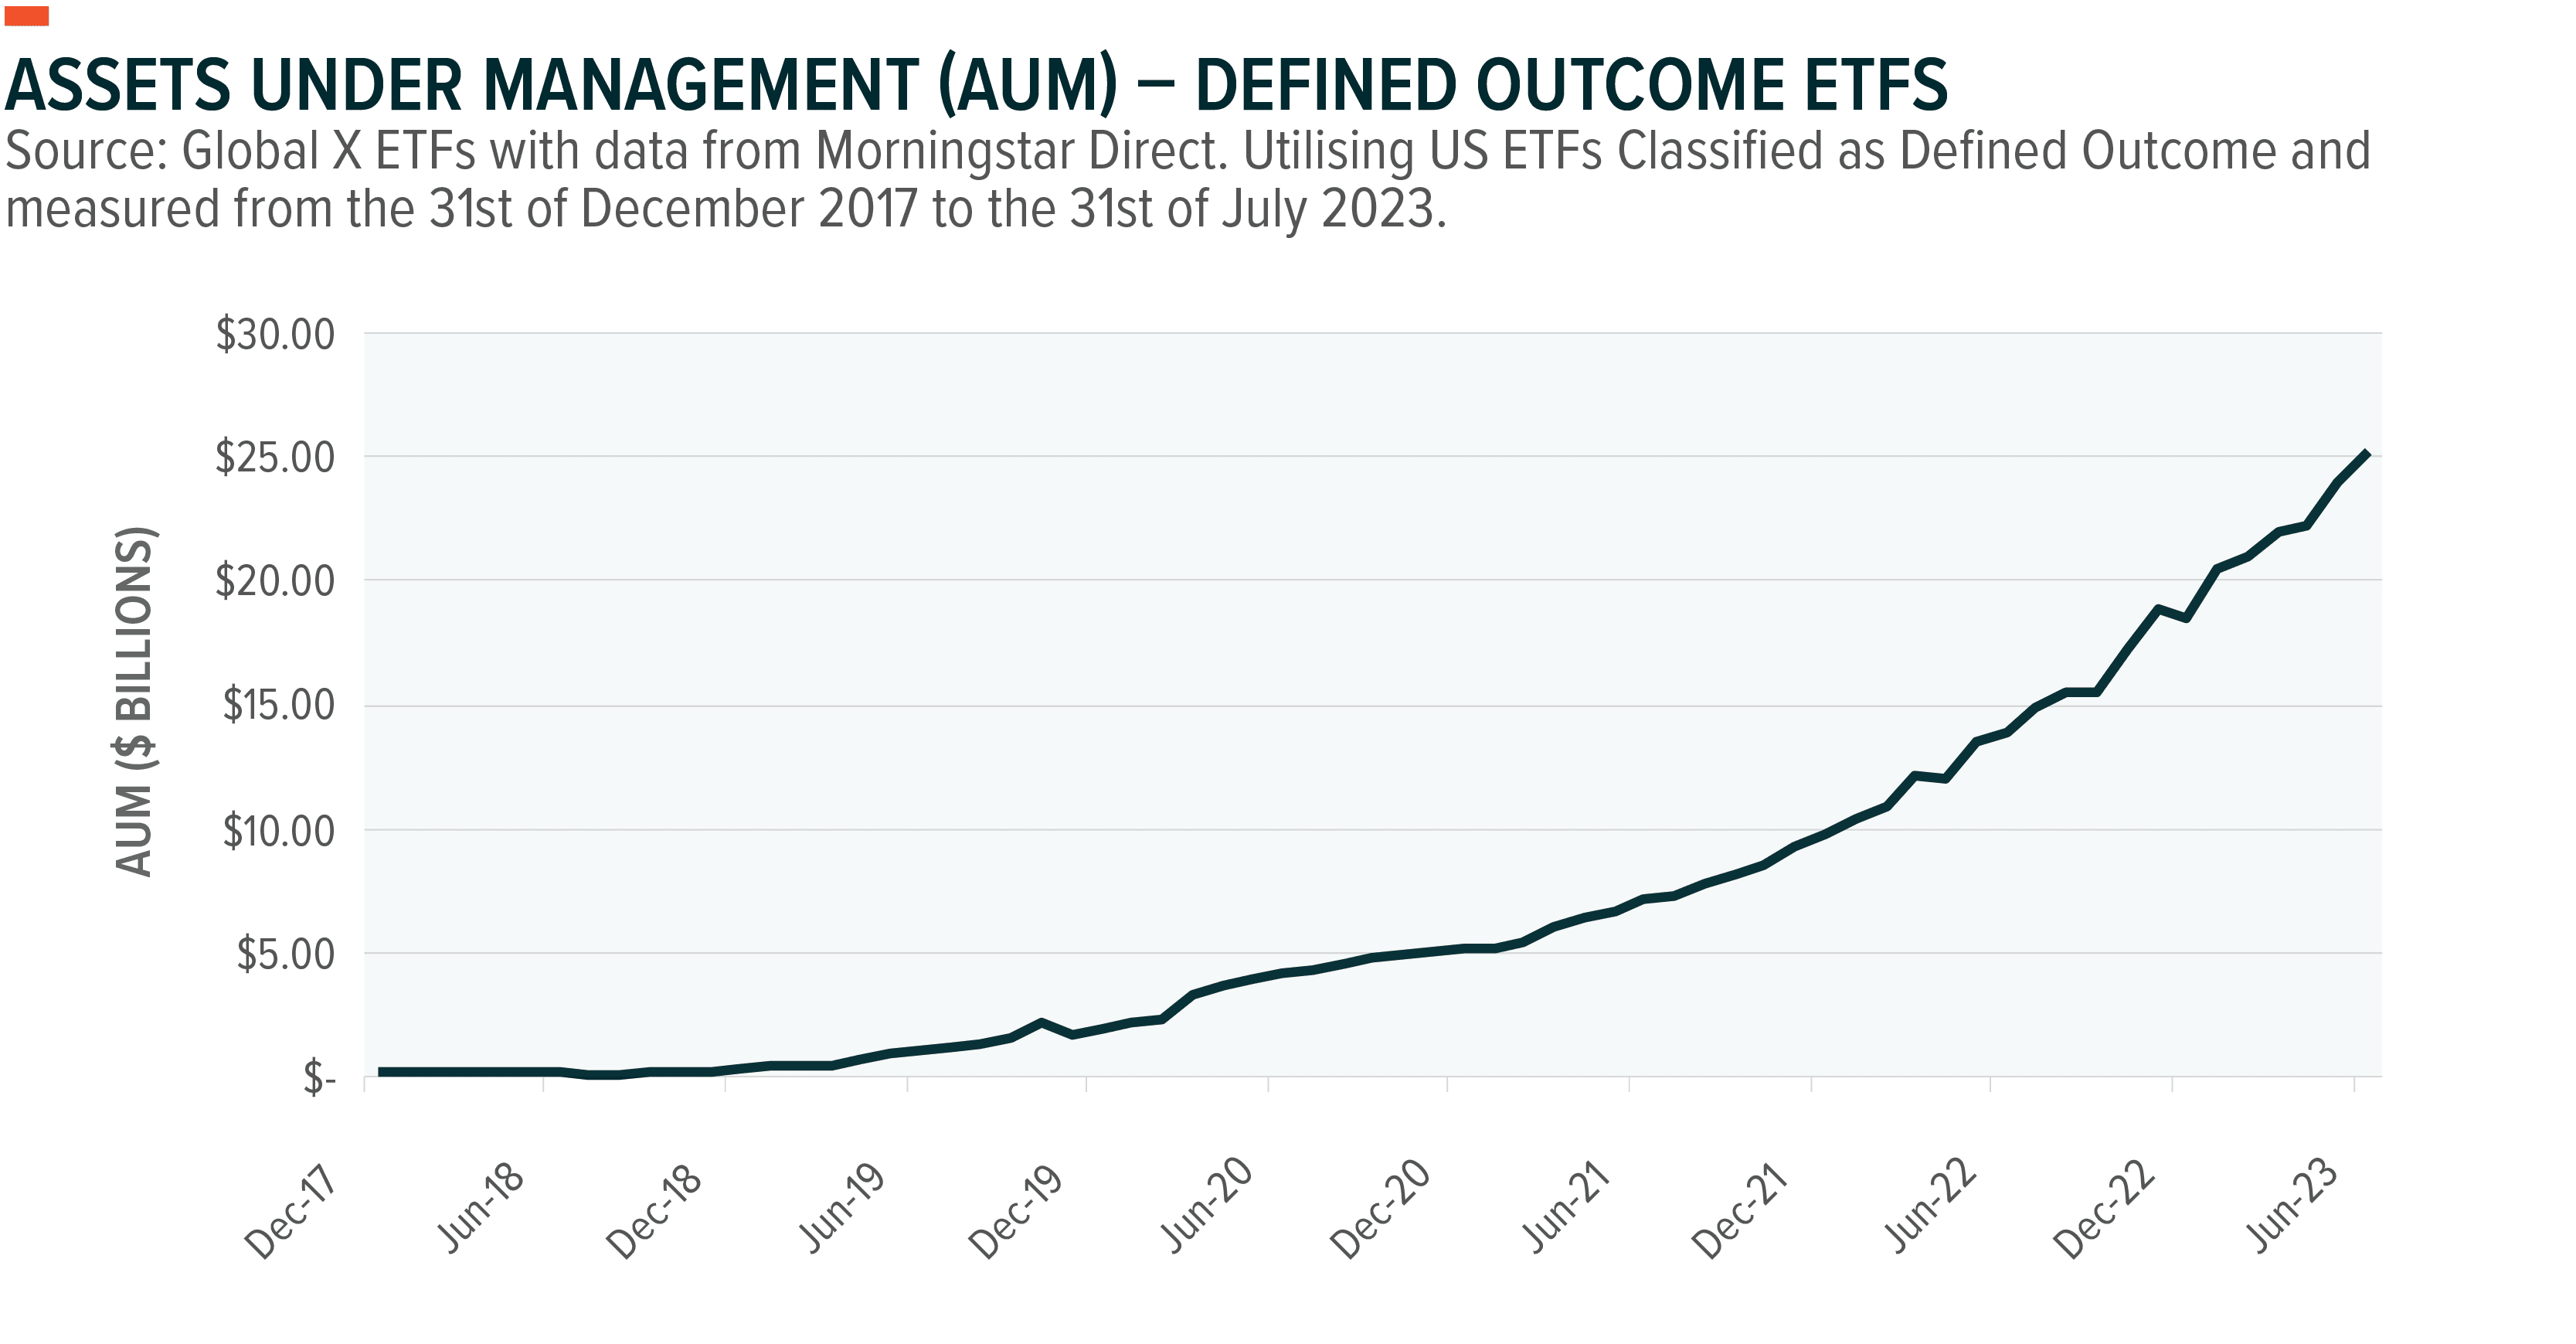
Defined Outcome strategies have started to garner more attention among market participants, and for good reason. These strategies can serve as a solution for lower volatility, effectively fitting into the 60/40 portfolio, where their stable returns contribute a layer of predictability amidst market unpredictability. The aim of defined outcome strategies is to curtail options premium costs while aiding investors in generating specific index returns. This is generally accomplished through a bear put spread combination (buying a higher strike put than the one being sold), thus creating a downside buffer. The difference between received and paid premiums is offset by selling a call option, capping returns, and establishing the strategy's net-zero nature. Over the last five years, which included significant market turbulence at times, assets under management (AUM) in the US for defined outcome strategies skyrocketed by over 10 times. In just the last year, their AUM nearly doubled.
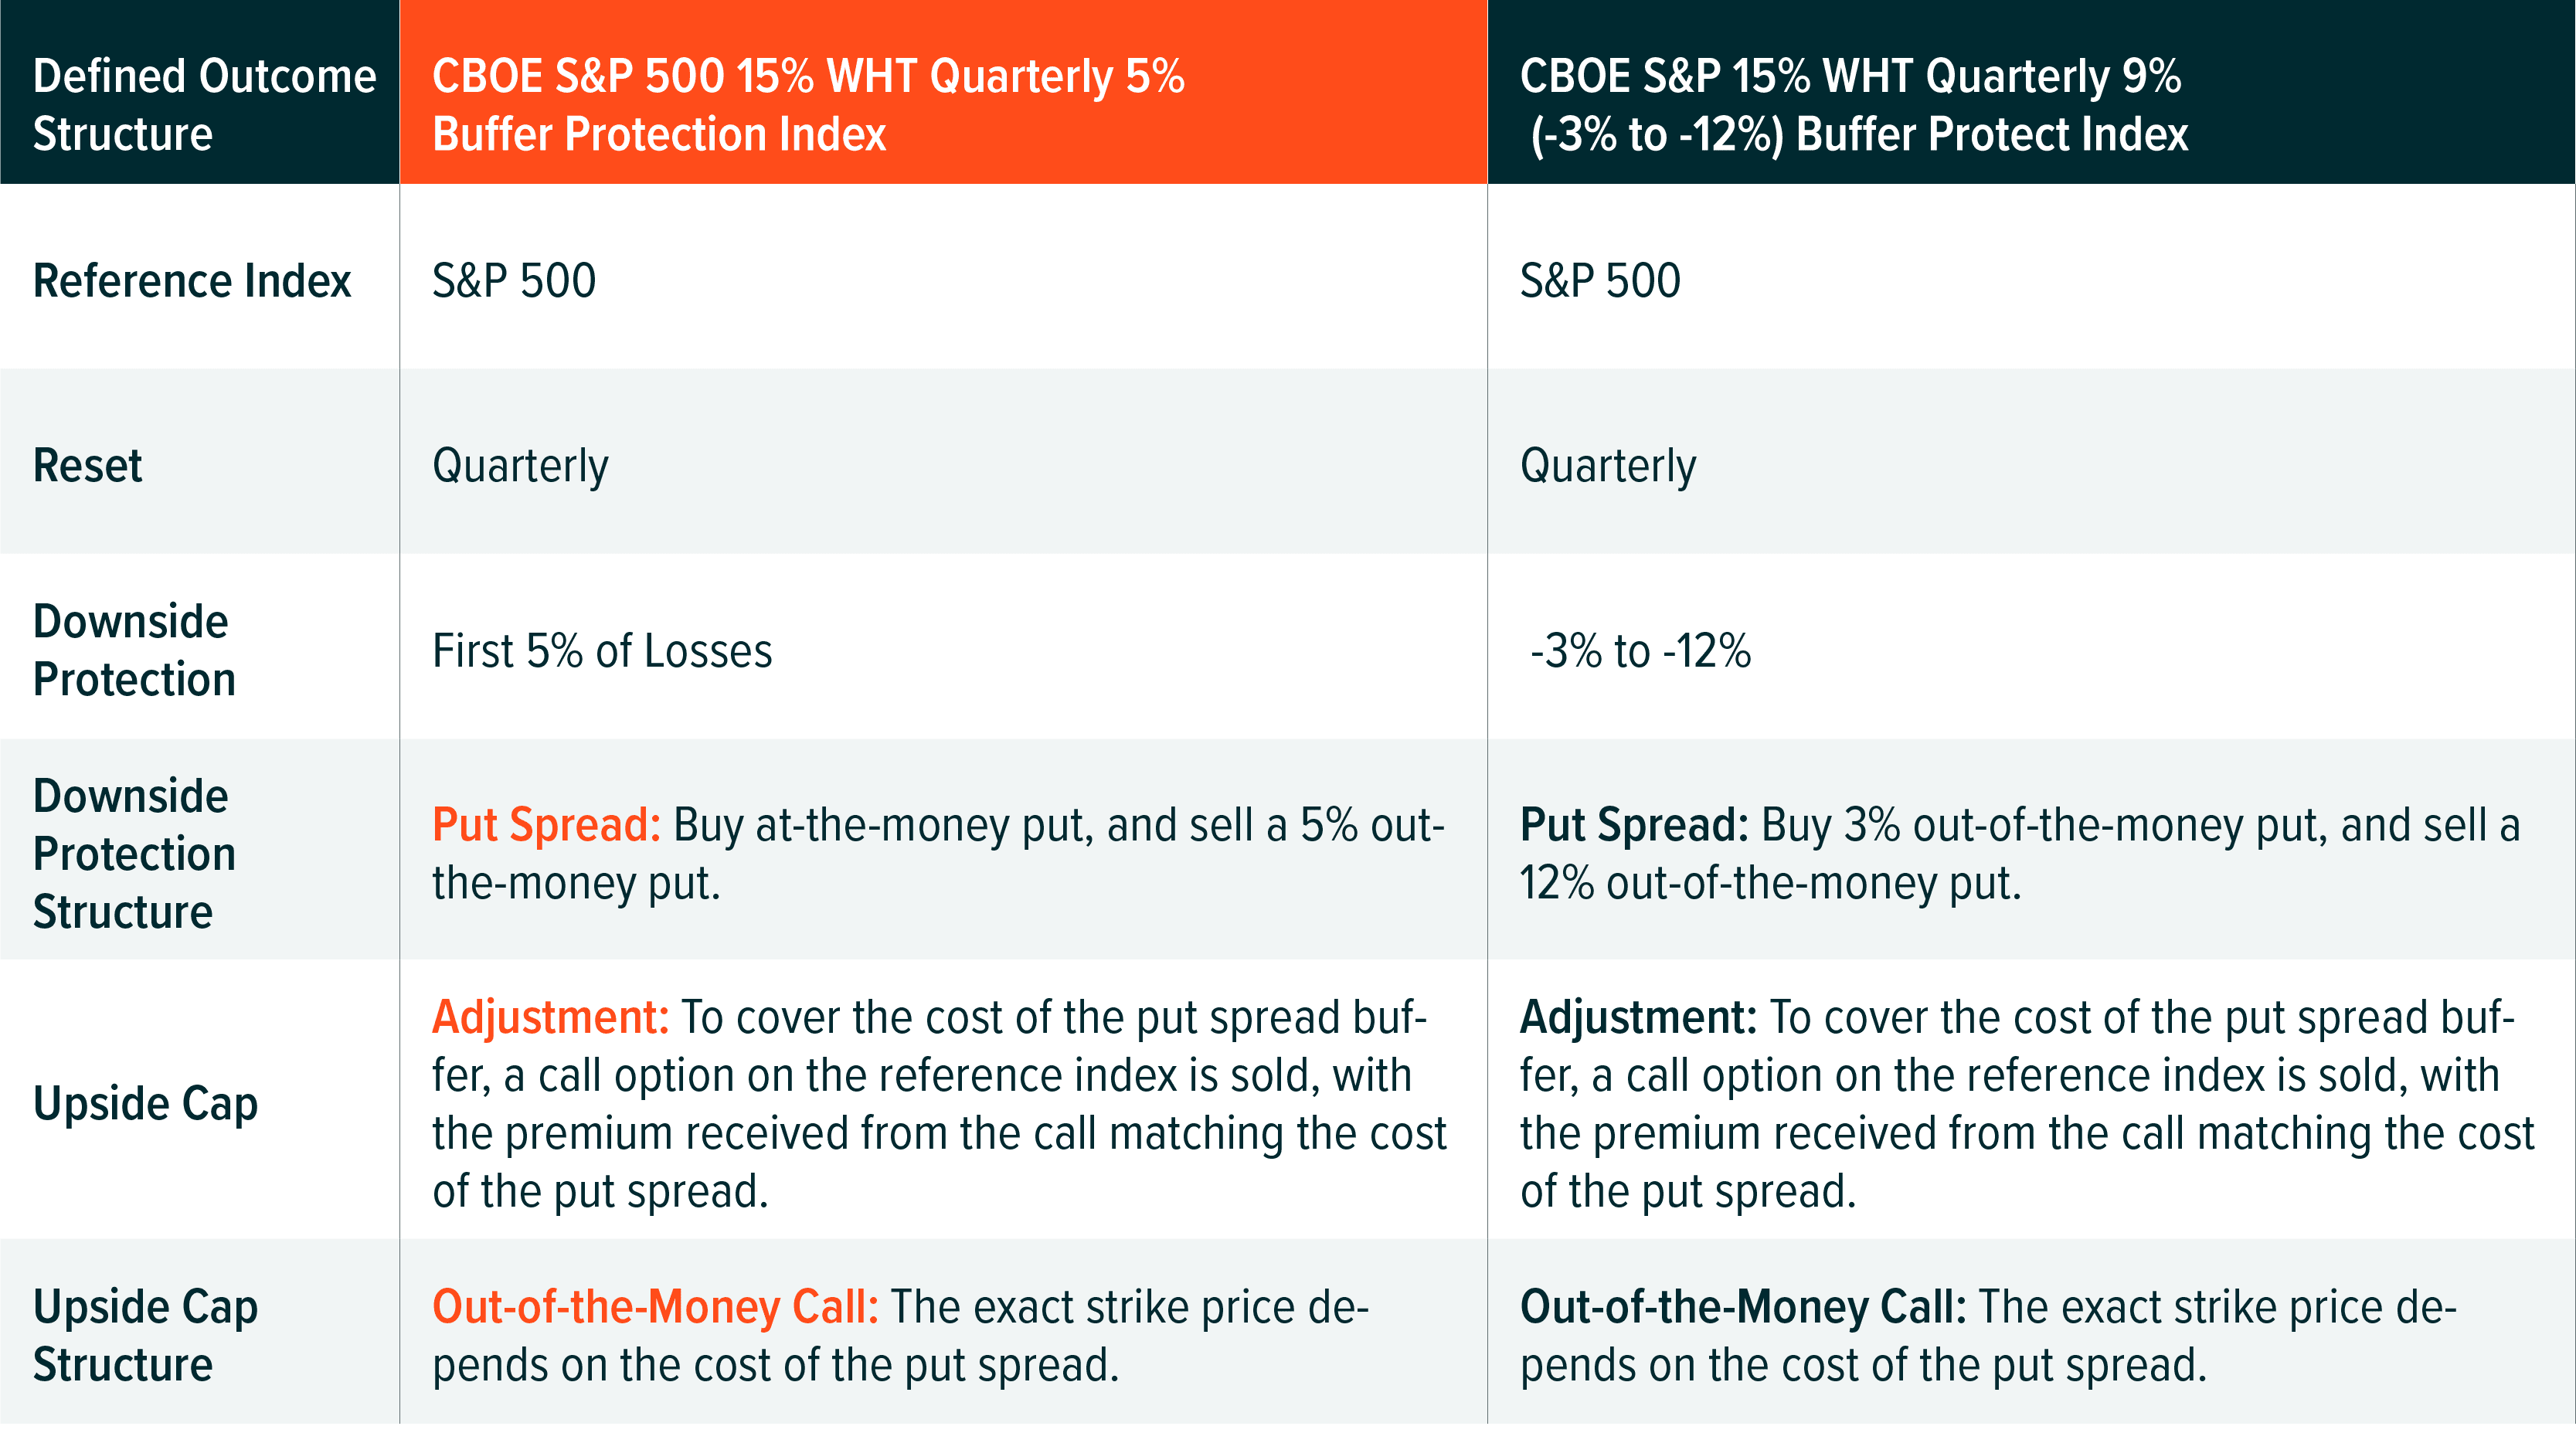
Defined outcome strategies could offer exposure to the returns of broad equity markets to a cap over a defined outcome period. These periods are typically monthly, quarterly, or yearly, after which point each index resets. The indices use a combination of put options and call options on a specified reference asset to provide a predetermined level of downside protection with equity upside participation, up to a cap. They incorporate option overlays, with the primary objective of offering predictable and specified risk mitigation for those whom hold the strategy from the initiation of the option contracts to their expiration.
For example, the Cboe S&P 500 15% WHT Quarterly 5% Buffer Protect Index incorporates a 5% buffer that resets each calendar quarter. Using a hypothetical portfolio containing a put spread of a long at-the-money put option position paired with a short 5% out-of-the-money put option position, this strategy limits losses over the calendar quarter up to a 5% drawdown in the S&P 500. Conversely, during an uptrend, full S&P 500 upside could be received up to a specified cap, based on the strike price of its covered call for the outcome period.
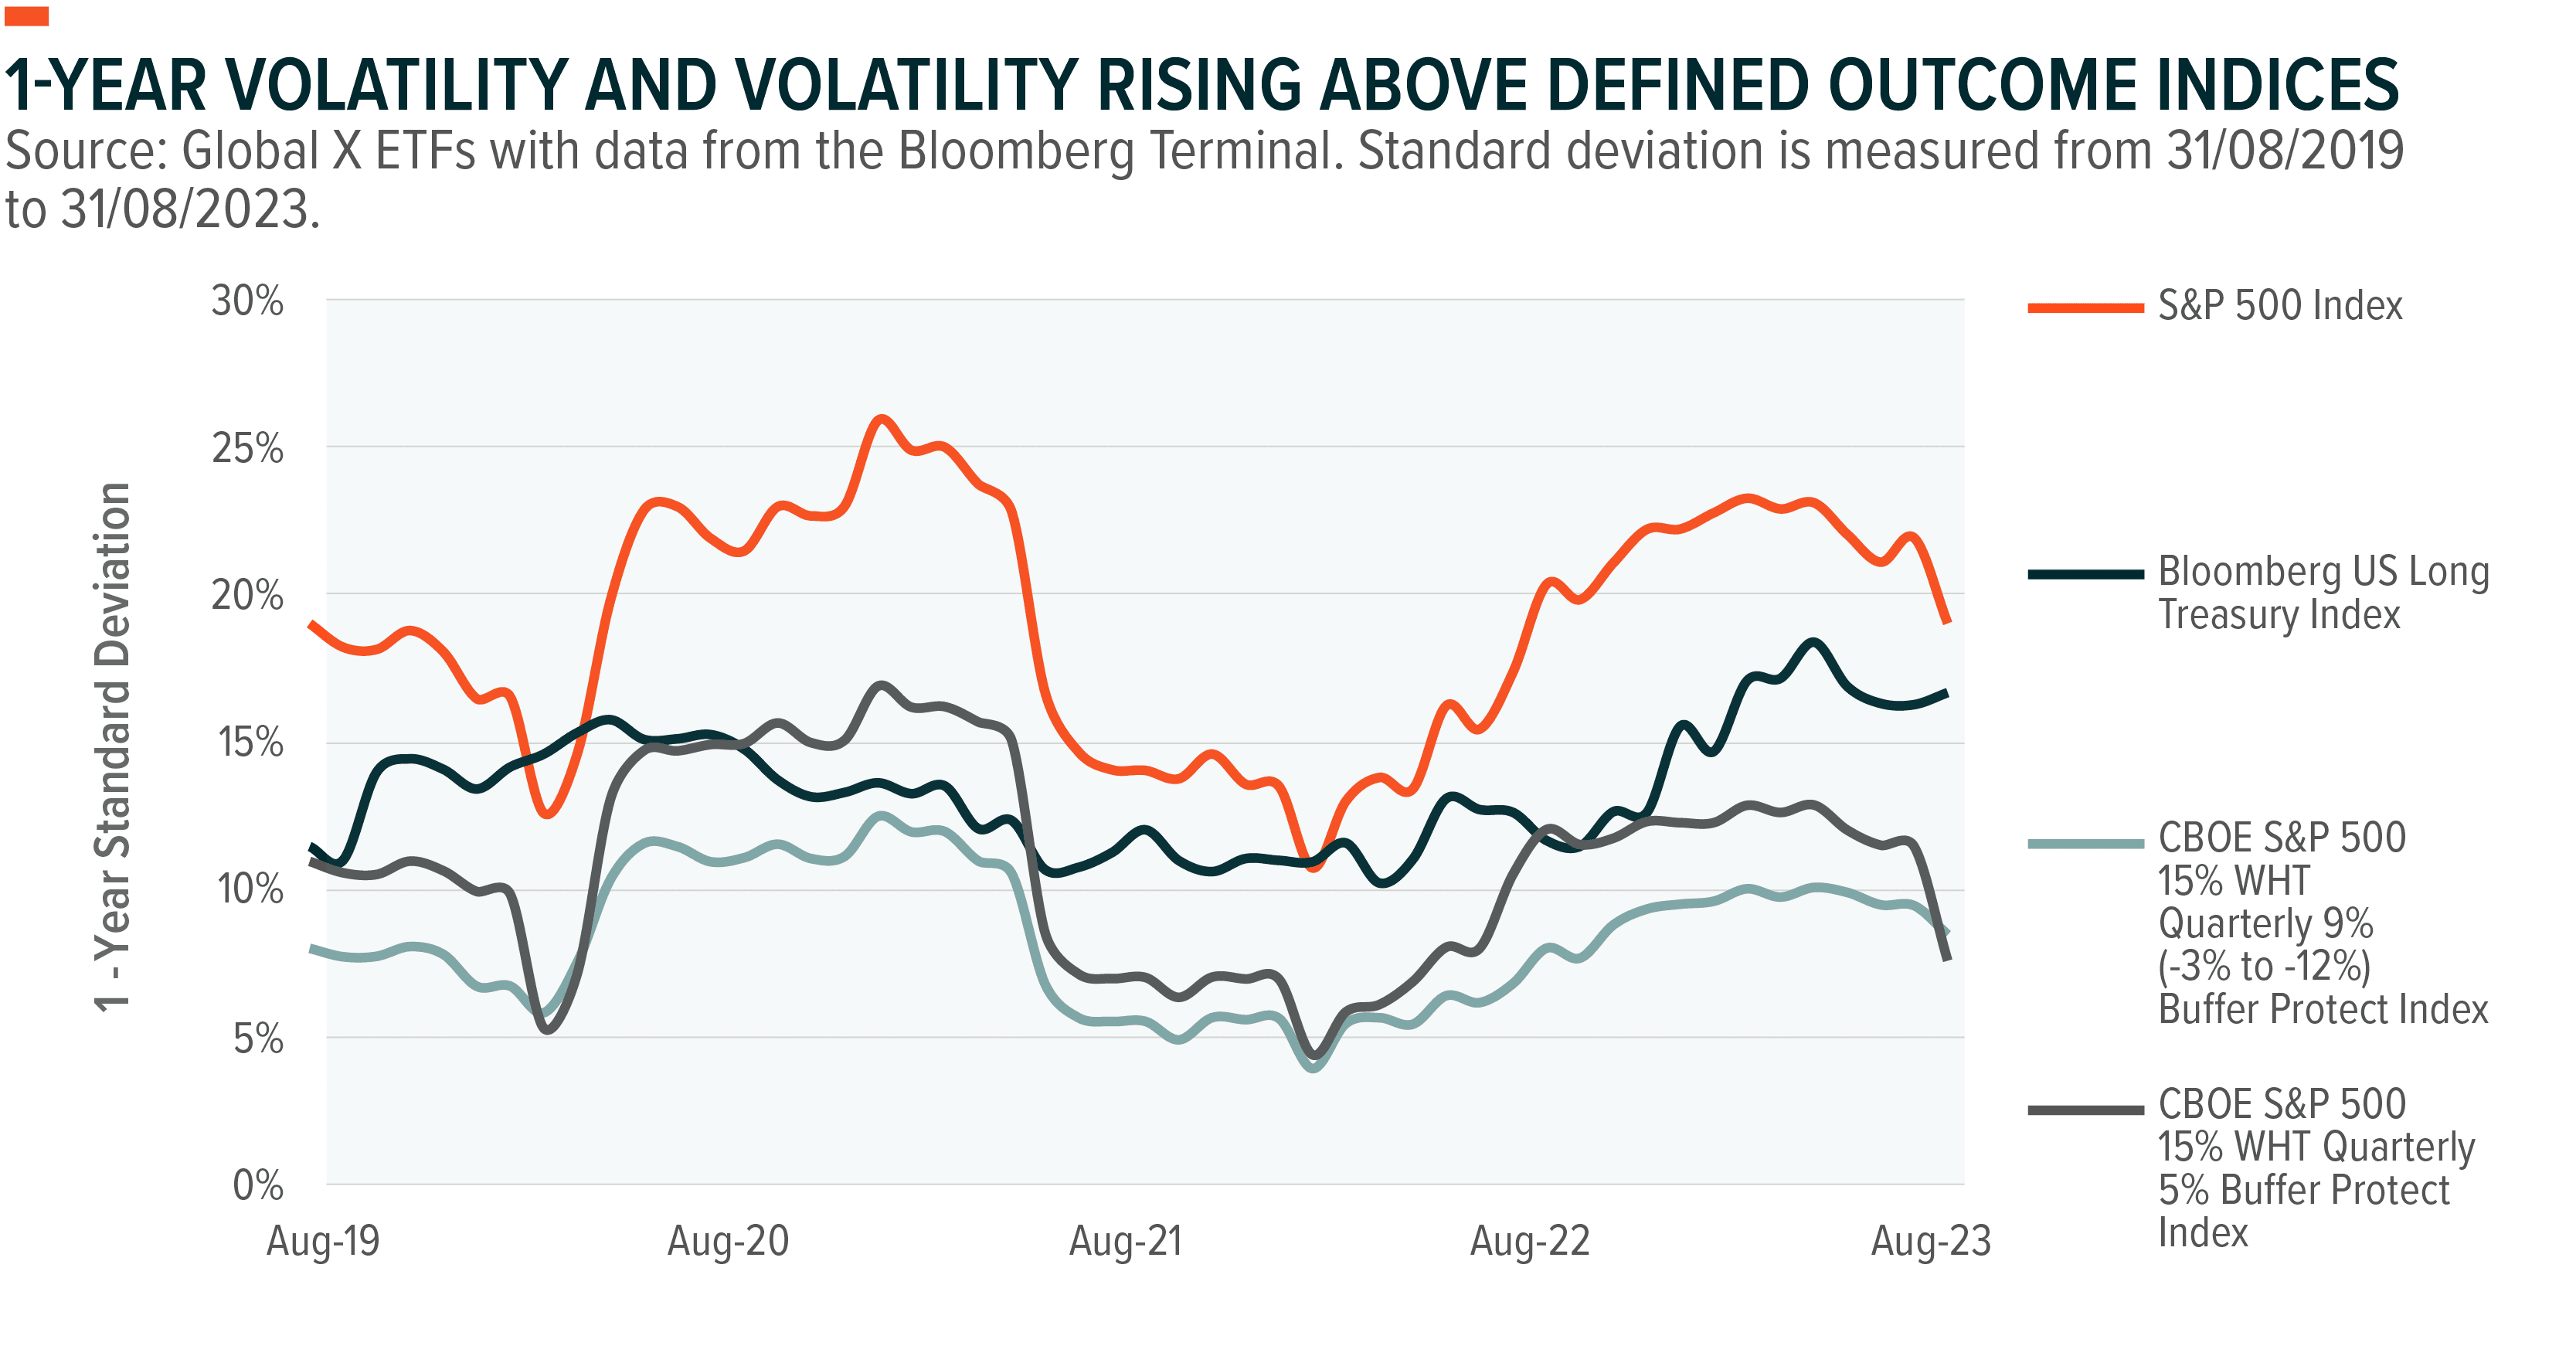
One of the key drivers behind the rising interest in defined outcome strategies is their ability to effectively dampen volatility and mitigate a portfolio’s risk metrics. Their performance during the latest Fed hiking cycle is an example, as the chart below shows. US long Treasuries produce a higher standard deviation, indicating greater volatility, than the Cboe S&P 500 15% WHT Quarterly 9% (-3% to -12%) Buffer Protect Index and CBOE S&P 500 15% WHT Quarterly 5% Buffer Protect Index and both defined outcome indices achieve a more controlled volatility profile during this rising rate environment.
The 2008 Global Financial Crisis (GFC) offers an instructive example of how volatility and monetary policy affect the relationship between equities and fixed income. While US long duration treasuries returned +24.03% in 2008, major equity indices such as the S&P 500, MSCI ACWI, and Nasdaq declined significantly. The S&P 500 declined -38.49%, the MSCI ACWI declined -41.82%, and the Nasdaq declined -41.58%.6
This performance disparity prompted a reliance on fixed income to mitigate portfolio drawdowns and sparked renewed interest in the 60/40 portfolio. Notably, a significant disparity emerged in fixed income between 2008 and 2020. Although both periods saw the Fed driving the policy rate zero bound, the notable distinction lies within the long-term yield dynamics. In 2008, the 10-year yield retreated modestly, lingering just below 2.50%.7 In contrast, 2020 witnessed an unprecedented plunge to historic lows.8 The 2020 divergence curtailed the conventional utility of long-term rates as a portfolio diversifier, introducing a new layer of complexity.
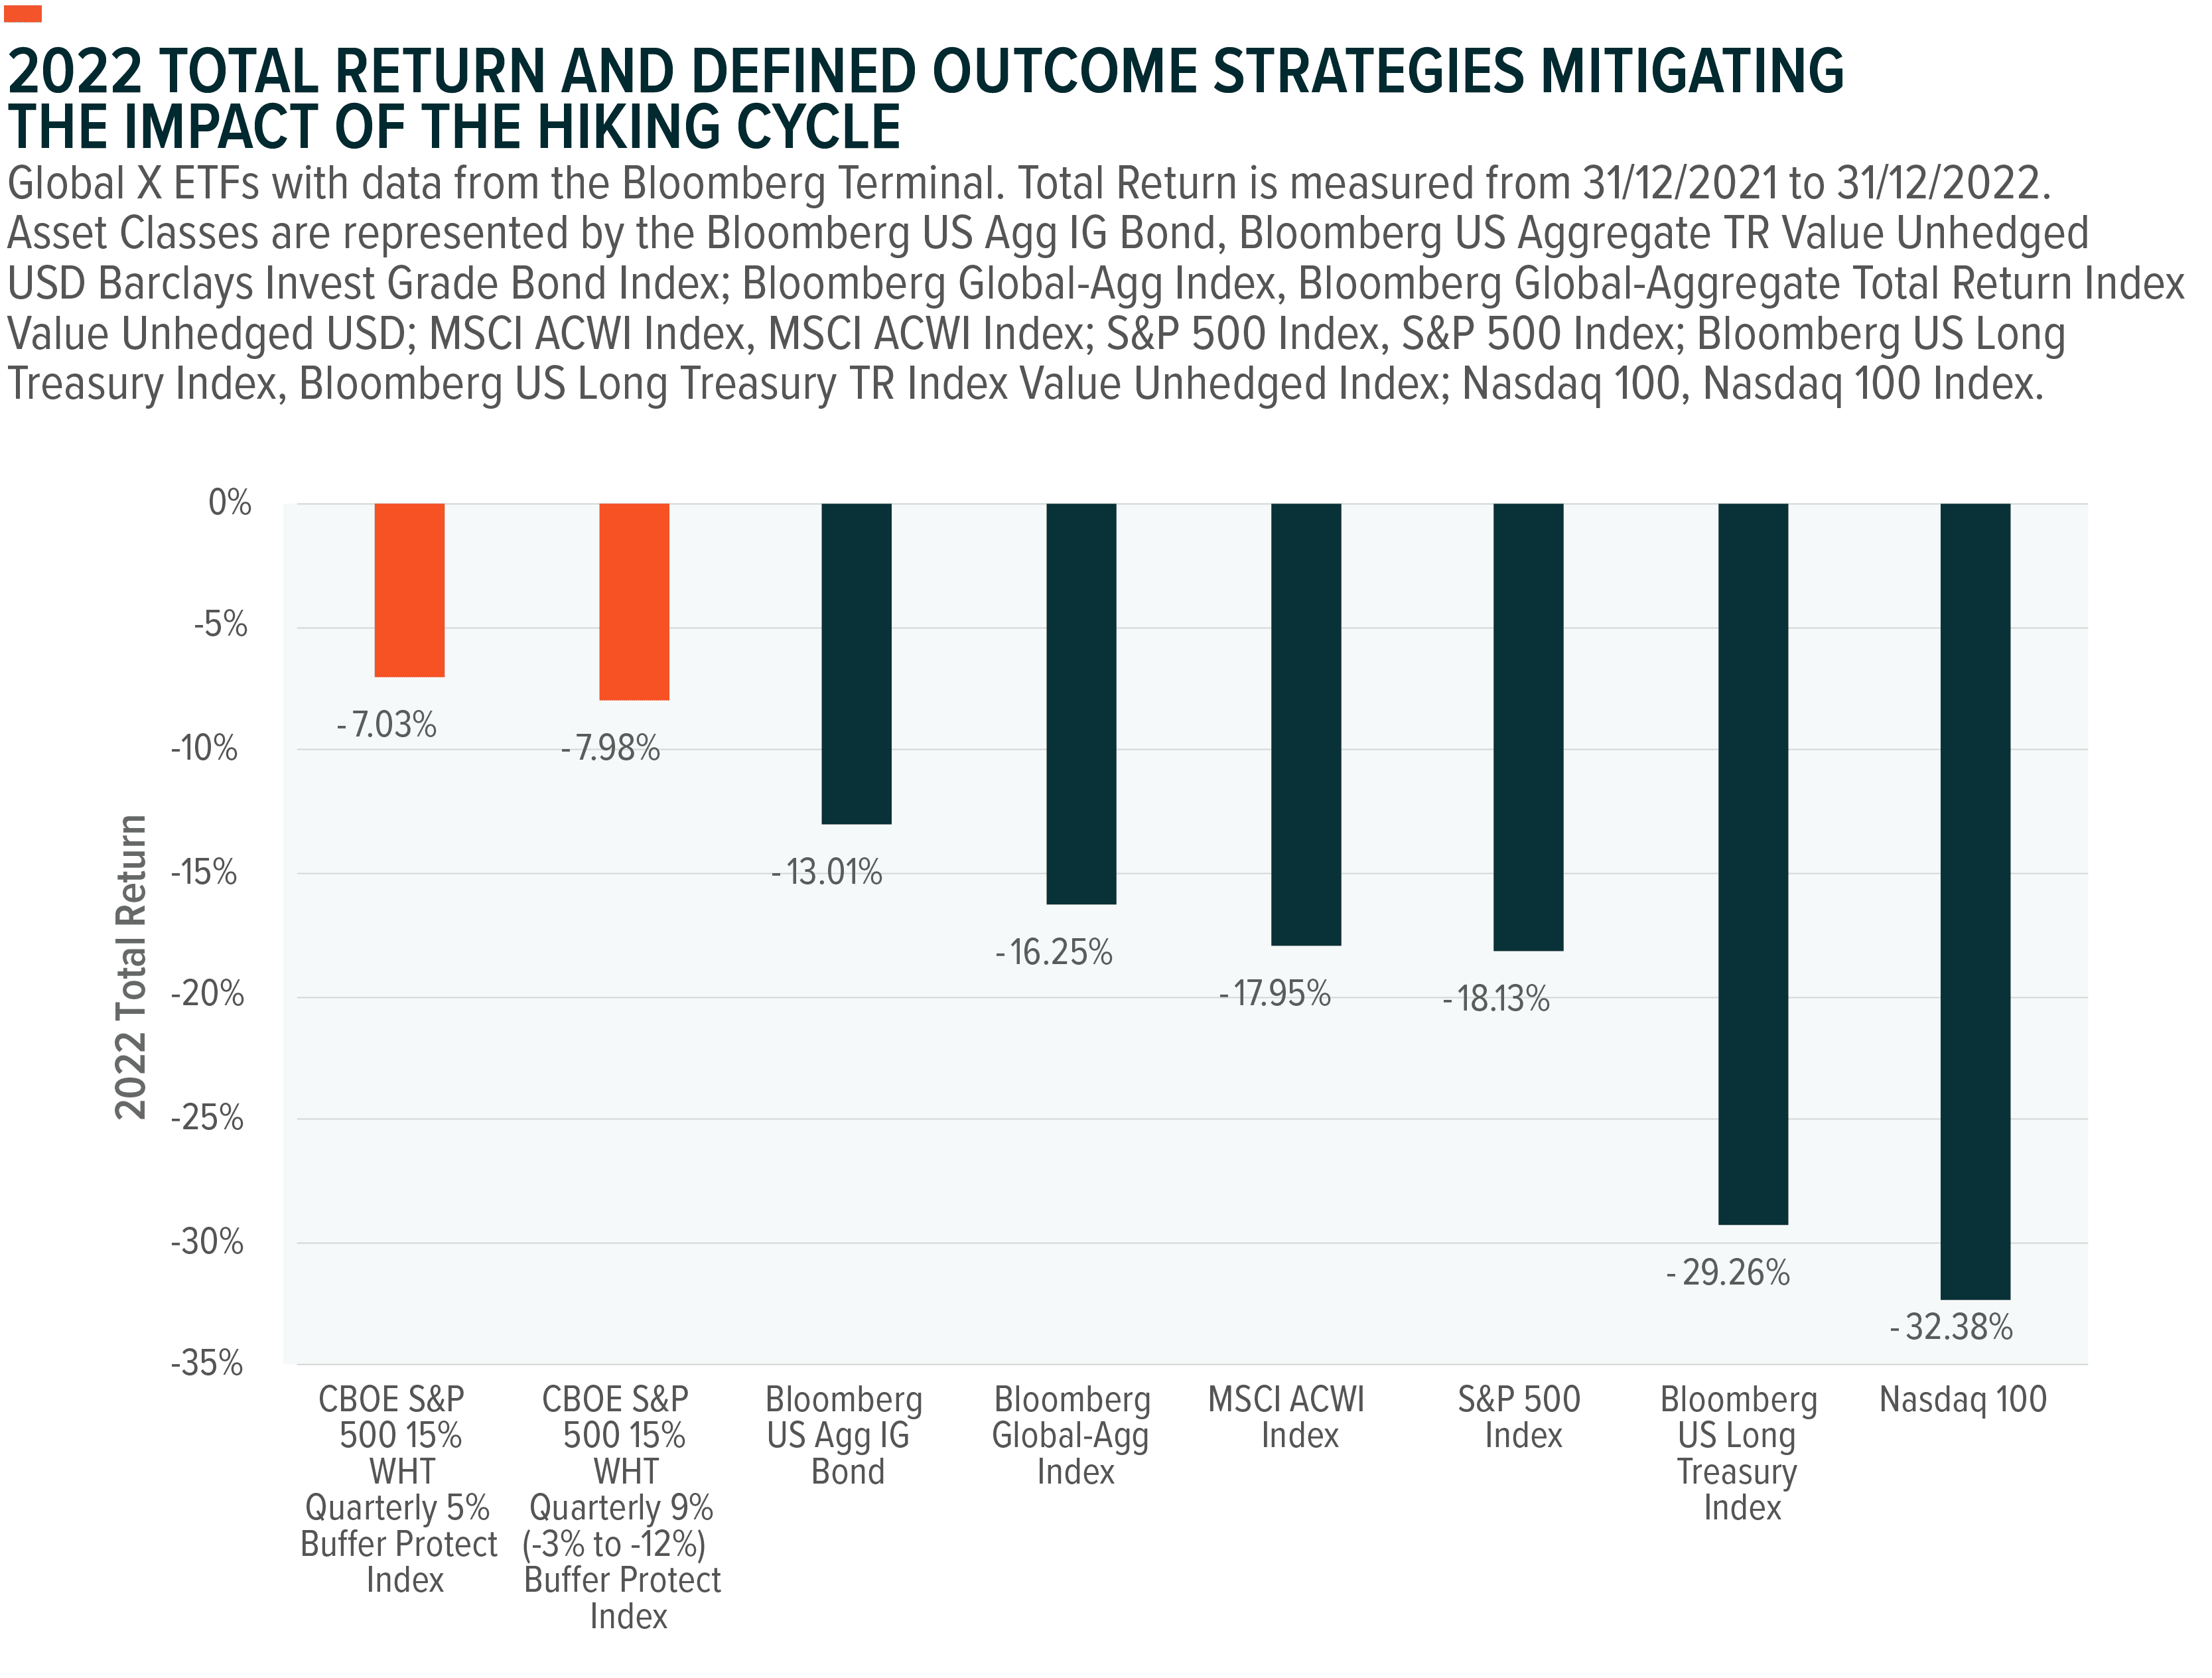
Only in 2022 did the risks of long-term bonds become apparent, as treasuries and investment-grade bonds moved in sync with equities due to mounting inflationary pressures. This led to an exploration of alternatives to narrow portfolio drawdowns. The chart below shows how defined outcome strategies outperformed the underlying S&P 500 Index and various fixed income and equity indices. With lingering inflation risks and sustained unemployment below the 5% threshold that triggered rate cuts in 2007, the correlation between stocks and bonds remains elevated, interest in these strategies is expected to remain high.9
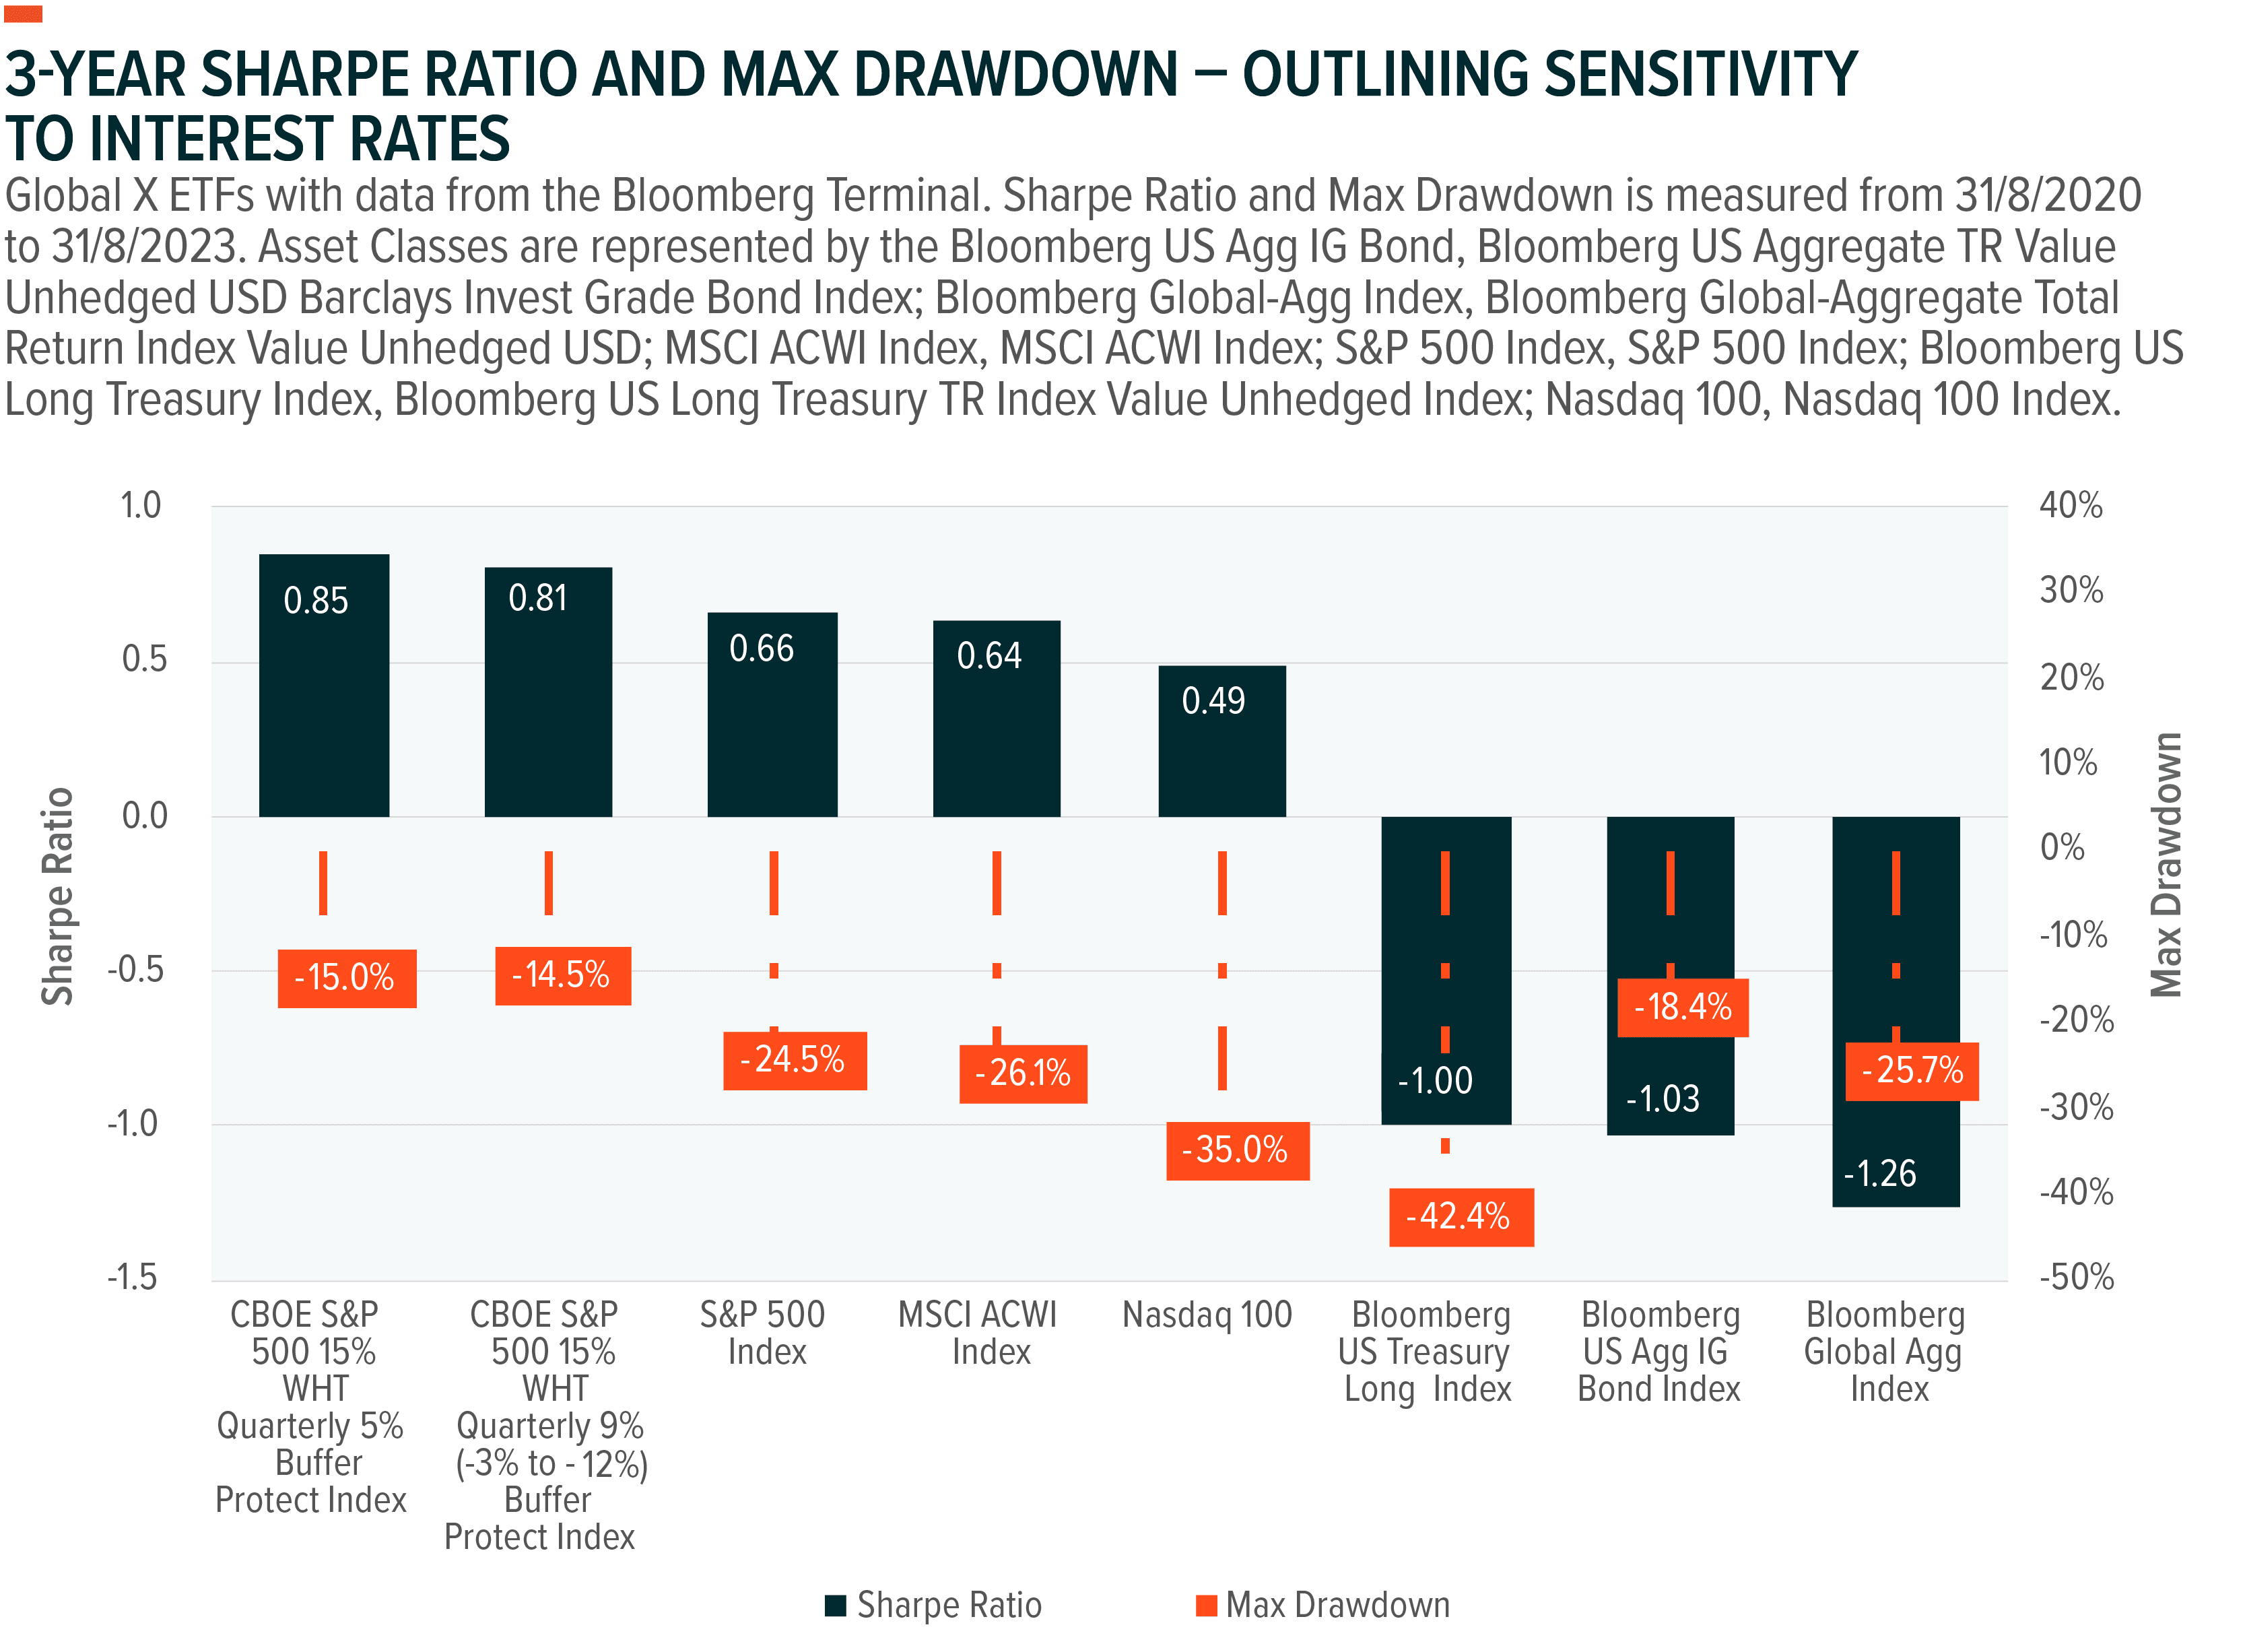
Similar to how defined outcome indices dampened the drawdown in 2022, a similar trend can be observed when comparing the max drawdown and risk-adjusted returns over a three-year basis. The CBOE S&P 500 15% WHT Quarterly 5% Buffer Protect Index and the CBOE S&P 500 15% WHT Quarterly 9% (-3% to -12%) Buffer Protect Index demonstrate superior downside risk management compared to broad equity and fixed income indices during the 2022 down market. Not only were their drawdowns less severe, but they also exhibited a higher 3-year Sharpe Ratio, a widely used metric for assessing risk-adjusted returns.
The chart below illustrates these strategies, depicting 3-year maximum drawdowns of approximately 15%, in contrast to the underlying S&P 500 index's drawdown of 24.5%. Notably, even US Treasuries, which measures the return of long-duration treasuries, experienced a decline of over 42%. It's worth noting that both the S&P 500 and US long duration treasuries, reached their maximum drawdowns in October 2022, underscoring the heightened correlation between broad stock and bond indices.
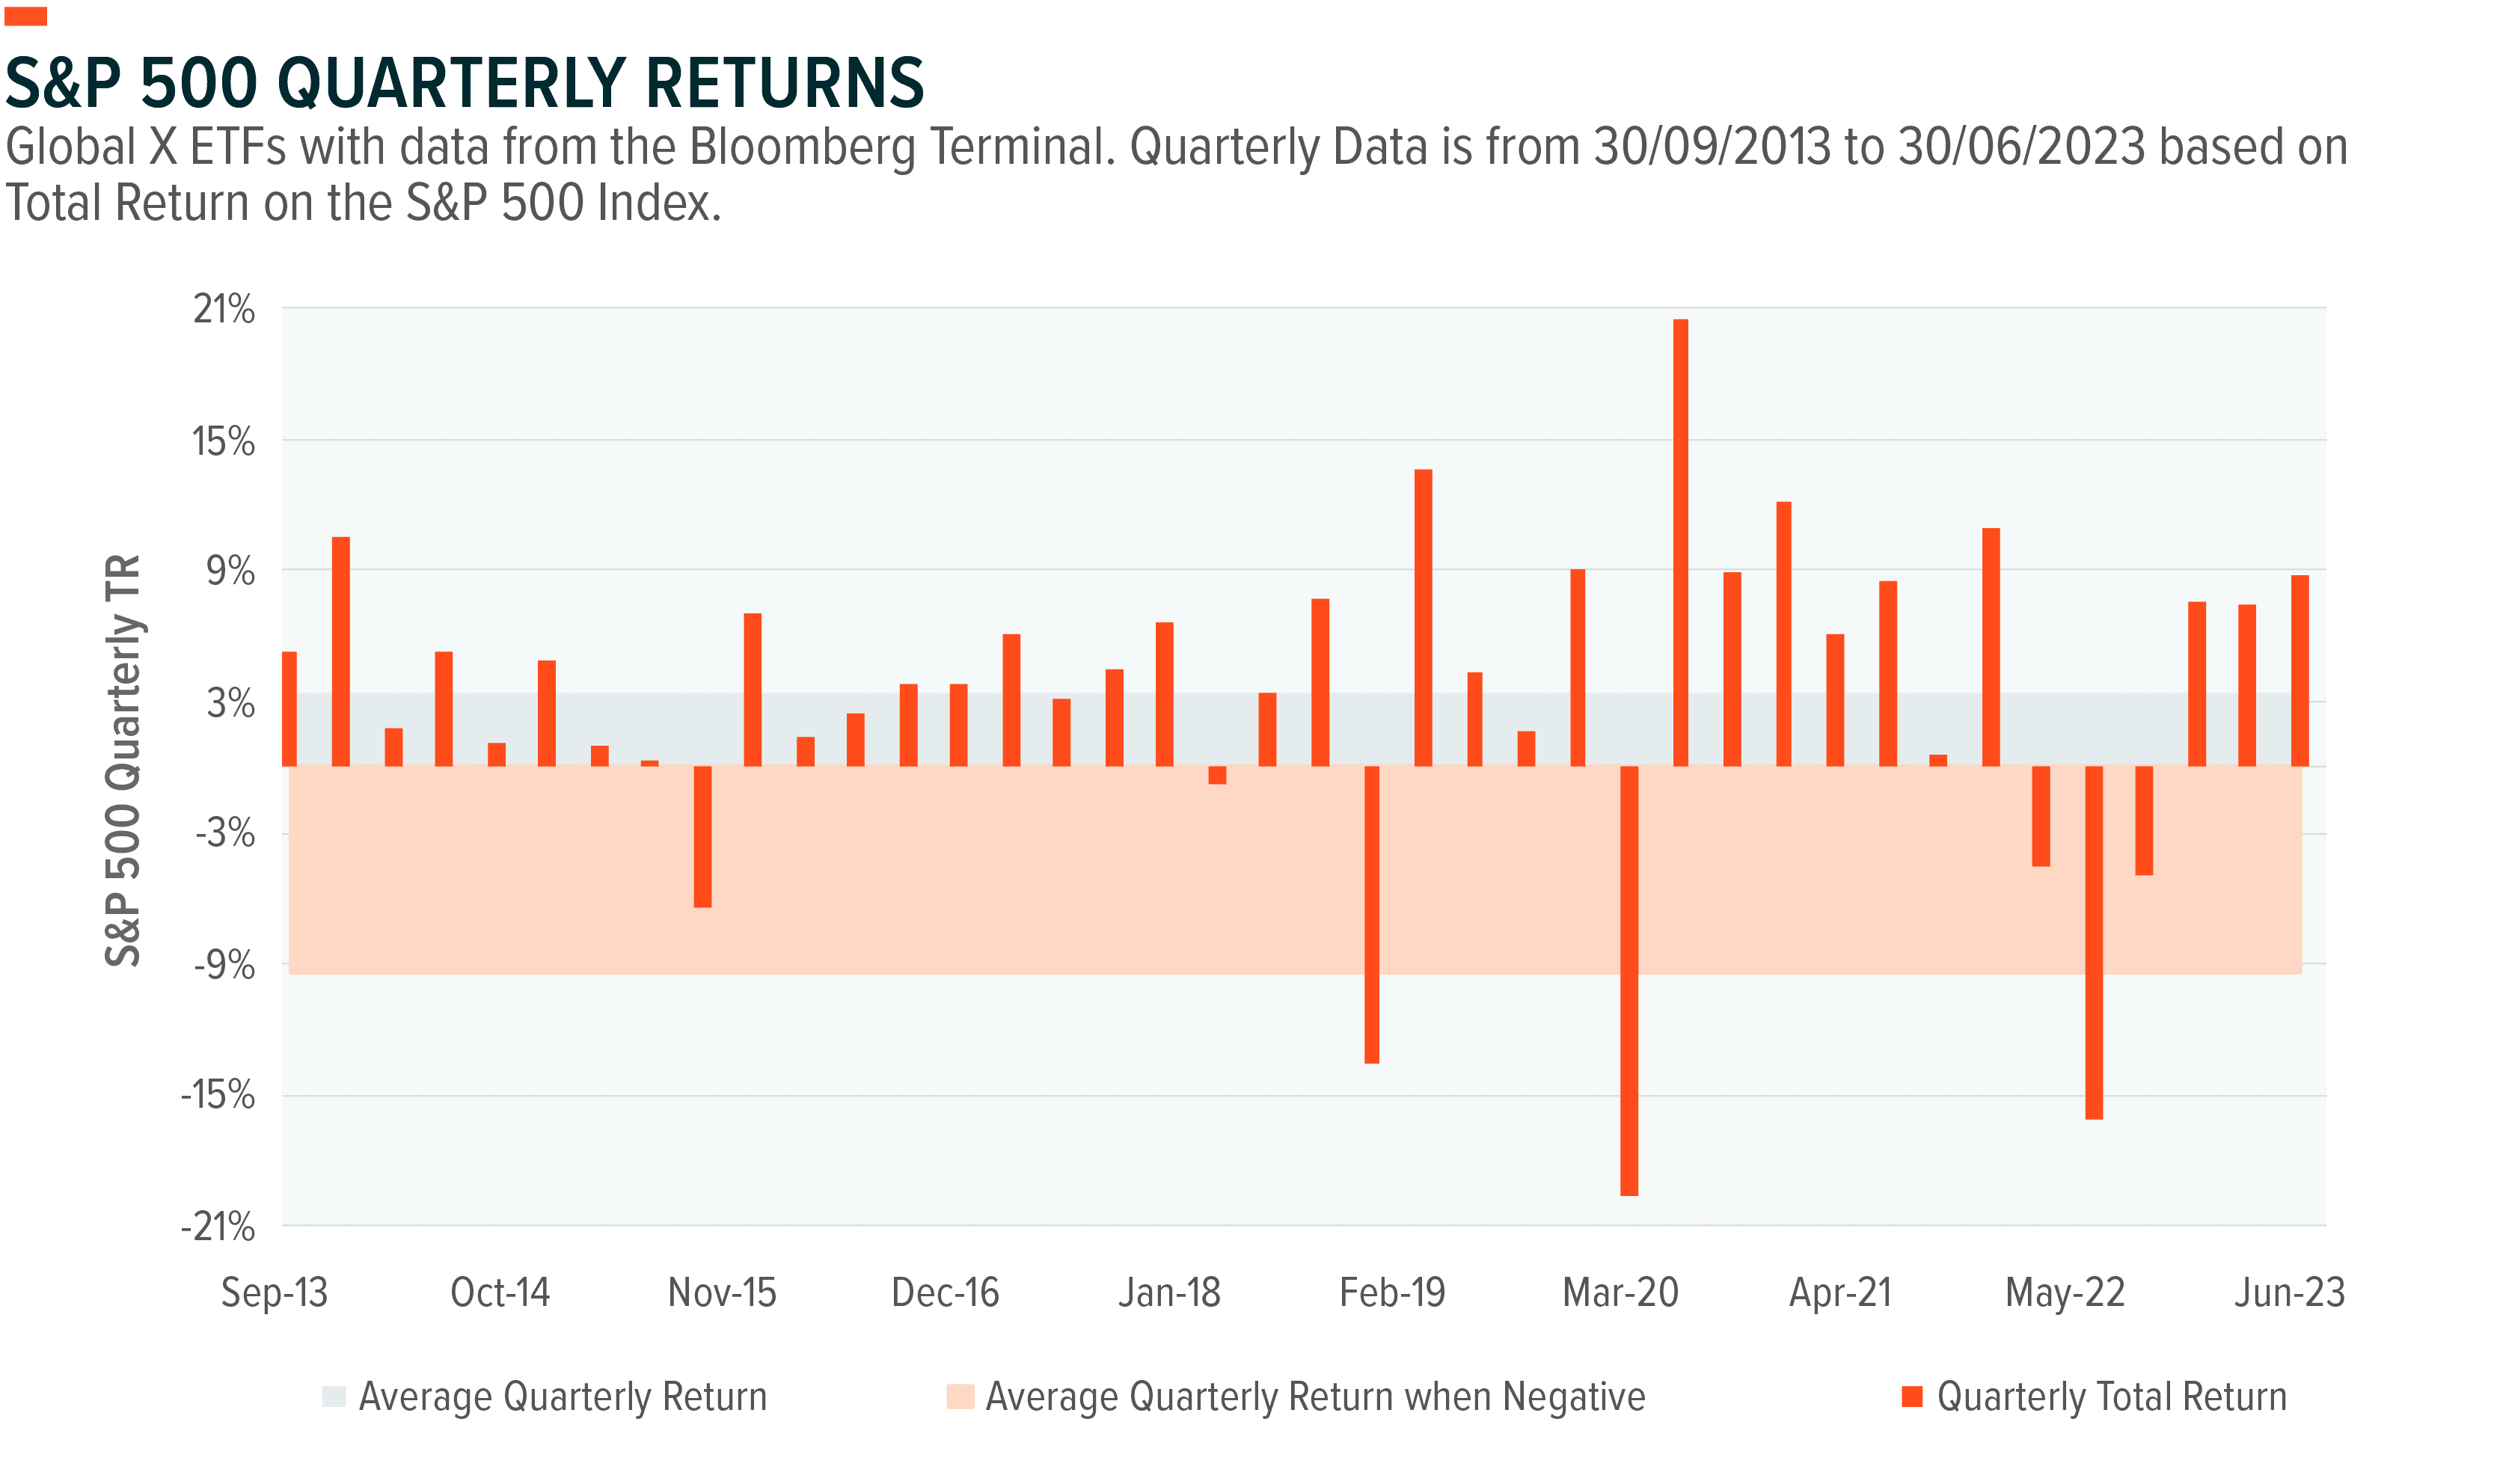
Beyond fixed income in the 60/40 mix, there is concern concerned about equity returns due to rising rates and expanding multiples. For instance, the S&P 500's price-to-earnings and price-to-sales ratios now surpass 5-year and 10-year averages.10 Notably, defined outcome strategies play a role in equity risk management. Over the past decade, the S&P 500 has seen an average quarterly return of +3.31%, while negative periods yielded an average quarterly return of -9.42%.11 This equity trend, often described as "stairs on the way up and an elevator on the way down," underscores the value of defined outcome strategies in mitigating downside risks. The Cboe S&P 500 15% WHT Quarterly 9% (-3% to -12%) Buffer Protect Index provides protection against drawdowns ranging from 3% to 12%, aligning with the average 10-year decline during negative quarters. This alignment offers a substantial measure of confidence and stability.
Defined outcome strategies have emerged as a promising option in terms of navigating the complexities of fixed income volatility and the rising correlation between stocks and bonds. These strategies can provide a compelling avenue to achieve more stable returns and effective risk management, making them a valuable component in a diversified investment portfolio. As the investment landscape continues to evolve, defined outcome strategies could offer a strategic advantage when seeking clarity and stability.
1. Bloomberg, L.P. (n.d.). [Asset classes represented by: Equity, S&P 500; Debt, Bloomberg US Aggregate Bond Index]. Source. The 60/40 Portfolio is represented by a hypothetical, quarterly rebalanced portfolio with a 60% weight in the S&P 500 index and a 40% weight in the Bloomberg US Aggregate Bond Index. Returns for 2023 are year-to-date as of 31/7/2023.
2. Bloomberg Terminal accessed on 31st July 2023. Federal Funds Rate and 10-year Treasury yield measured from the US Federal Funds Effective Rate Index and US Treasury Curve Rate T Note Constant Maturity 10 Year Index, respectively. Treasury rates below inflation rates are evaluated using the Graph Curve function in Bloomberg against US CPI Urban Consumers YoY NSA index as of 30th June 2022.
3. Equity returns are represented by S&P 500 (includes dividends), and Treasuries represent U.S. T-Bond data based on annualized total return data from 1928 to 2023. Accessed on 15th July 2023 from: Damodaran, A. (2023, January). Historical Returns on Stocks, Bonds and Bills: 1928-2022. Stern School of Business, New York University.
4. Global X analysis with information derived from: Bloomberg L.P. (n.d.) (data set). Data is derived from the US Federal Funds Rate, represented by the US Federal Funds Effective Rate (continuous series) index from 31/03/2001 to 31/07/2023.
5. Global X analysis with information derived from: Bloomberg L.P. (n.d.) (data set). GDP represented by the US Chained 2012 Dollars QoQ SAAR. Q1 and Q2 produced negative QoQ GDP prints at -1.60% and -0.60% respectively. EPS data is derived from the S&P 500 Index from the Earnings & Estimates function. Data accessed on 18th July 2023.
6. Global X ETFs with information derived from Bloomberg. [Data Set]. Data from 31/12/2007 through 31/12/2008 and accessed on 25th July 2023 from Global X Bloomberg Terminal.
7. Bloomberg Terminal accessed on 31 July 2023. 10-year Treasury yield measured from the US Treasury Curve Rate T Note Constant Maturity 10 Year Index, respectively.Accessed on July 27th 2023.
8. Ibid.
9. Ibid
10. Bloomberg. [Data Set]. S&P 500 Index data 5 Year Price to Earnings and Price to Sales from 31/07/2018 to 31/07/2023 and 10 Year Price to Earnings and Price to Sales from 31/07/2013 to 31/07/2023.
11. Bloomberg. [Data Set]. Data as of 30/06/2023 and accessed on 31st July from Global X's Bloomberg Terminal. Using quarterly calendar total return data from the S&P 500 index.